
(according to BDG Guideline P 350, using cast iron as an example)
The interpretation of generated cooling curves is used to evaluate and monitor the condition of the molten metal using apromaceTA.
Interpretation of measurement curves during cooling
The temperature development in a melt during cooling is determined by the phase transformations in the phase diagram of the specific material system, primarily from the liquid to the solid state, as well as within a phase, for example, between different crystal structures. If a transformation process occurs at temperatures below the temperature indicated in the phase diagram, the melt is referred to as supercooled.
The consideration of the cooling rate and its change due to transformations in the melt requires the use of mathematical curve analysis to evaluate the recorded temperature data and identify the characteristic points in the curves. Accordingly, breakpoints in the first derivative are marked by an infinitesimal slope (=0), and inflection points by a maximum/minimum of the slope.
Interpretation of cooling curves using the example of cast iron melts
In the area of eutectic solidification, two main types of cooling curves can be distinguished: a curve with pronounced undercooling (see figure) and one with slight undercooling (see figure), whereby the formation of the microstructure is determined by the position of the cooling curve relative to the solidification interval.
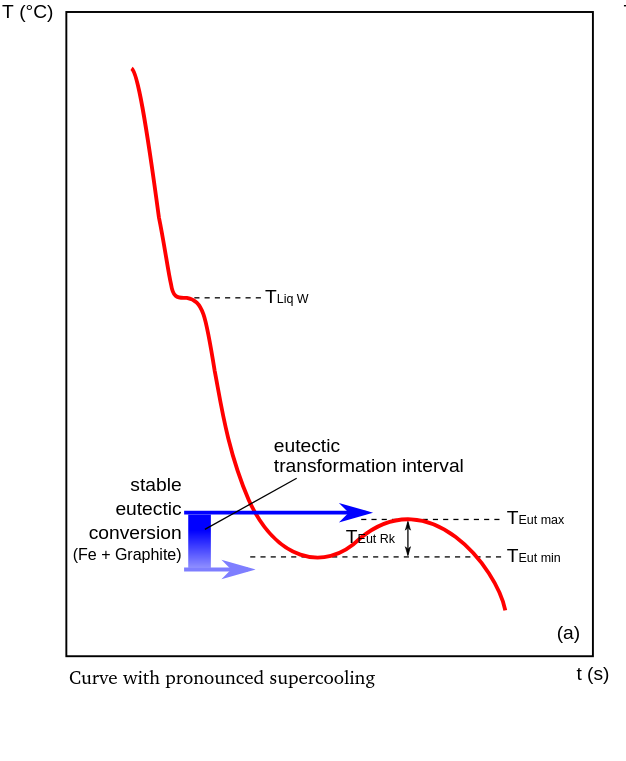
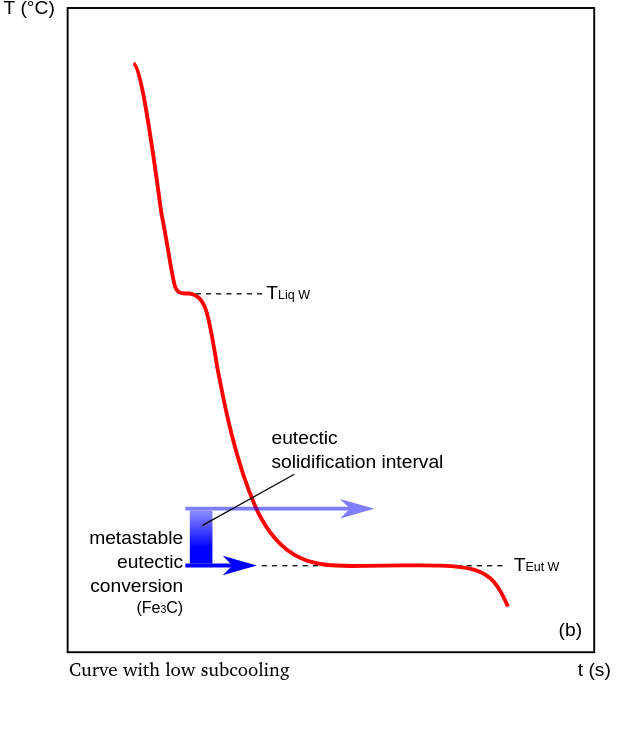
In detail, the absence of supercooling and the placement of the eutectic temperature at or below the limit of the solidification interval TEutW indicate carbide solidification (Fe3C) combined with delayed or non-existent graphite crystallization. Based on the dominant gray values in the cross-section of a carbide-strengthened casting, this type of solidification is called white. If the cooling curve is characterized only by supercooling above the metastable eutectic transformation, free graphite crystallizes in the microstructure. If the undercooling TEut RK is minimal, the melt was most likely inoculated to improve/optimize nucleation.
For a hypoeutectic melt, the characteristic points in the cooling curve can be interpreted as follows:
For a hypoeutectic melt, the characteristic points in the cooling curve can be interpreted as follows:
In the melt with a carbon content below the eutectic composition of 4.3 wt.% (Fig. Y (1)), primary austenite crystallizes upon reaching the liquidus temperature, and the released heat of crystallization slows the cooling (Fig. Y (2)). In the range between the liquidus temperature and the eutectic temperature (Fig. Y (3)), austenite (γ-iron) continues to crystallize during cooling. The composition of the melt evolves through the depletion of iron content according to the liquidus line until the eutectic composition and the corresponding temperature are reached (Fig. Y (4)). The simultaneous solidification of austenite and graphite (carbon modification, gray solidification) or cementite (Fe3C, white solidification) creates an equilibrium between the heat dissipated by cooling and the heat released by solidification, which is represented by a breakpoint in the cooling curve.
Undercooling defines the difference between the eutectic temperature, which is conveniently assumed to be 1150°C, and the lower eutectic temperature TEut min (Fig. 4 (a)). The temperature increase from the lower to the upper eutectic temperature TEut max, which occurs during gray solidification, is caused by the heat of crystallization of the graphite and is referred to as recalescence.